
Chapter 07 of 12
API Performance Testing: Load, Stress and Soak
Load, stress and soak profiles, why the p95 beats the average, how to turn a latency budget into a pass or fail, and where a load test must never point.
Correctness testing asks whether the answer is right. API performance testing asks what happens when a thousand callers want that answer at the same moment, and the two have almost nothing in common except the request they send.
Decide the budget before you run anything
A load test without a target produces a number, and a number without a target produces an argument rather than a decision. Somebody says 400 milliseconds looks fine, somebody else remembers it used to be 200, and nobody can say whether the release should ship.
A budget turns the run into a decision that answers itself. Write it down before the first test, in roughly this shape.
The orders endpoint answers within 300 ms at the p95, at 50 requests per second, with an error rate below 0.1 percent.
Every part of that sentence does work. The endpoint names what is measured, the percentile says which requests count, the throughput says under what conditions, and the error rate stops a service from meeting its latency target by failing fast.
Three profiles, three questions
| Profile | Traffic shape | The question it answers |
|---|---|---|
| Load | Steady, at expected peak volume | Does the service hold its budget on a busy day |
| Stress | Increasing until something breaks | Where is the ceiling, and how does it fail when crossed |
| Soak | Moderate, sustained for hours | Does anything degrade over time |
Load is the profile you run most often, and it is the one that belongs in a release checklist. It produces a straight pass or fail against the budget you wrote above.
Stress is a discovery exercise rather than a gate. Its value is in how the service fails, because a service that sheds load with 503 responses and a Retry-After header is in far better shape than one that accepts everything and times out. Run it when capacity planning or before a campaign, rather than on every release.
Soak catches the one thing the other two cannot, namely slow degradation. Connection pools that leak, caches that grow without bound and memory that never comes back all look perfect for the first ten minutes.
Read the distribution, not the average
The single most common mistake in an API performance report is presenting the results as a table of averages.
| Metric | What it tells you |
|---|---|
| Average | Almost nothing on its own, because one slow request in a hundred barely moves it |
| p50 | The typical experience |
| p95 | The experience of the unlucky twentieth caller, and the source of most complaints |
| p99 | The tail, which matters when one page makes many calls and therefore hits it often |
| Max | Useful only as a hint about timeouts and outliers |
A run averaging 120 ms with a p95 of 3 seconds is a bad run by any standard your users would recognise. The average will not say so, and a dashboard that only shows averages will let it ship.
The error rate deserves equal billing. Latency measured over successful requests only, while a quarter of requests fail, is a meaningless number that looks excellent.
Concurrency is not throughput
Two settings get confused with each other regularly, and confusing them produces a test that measures something nobody asked about.
Concurrency is how many requests are in flight at once, while throughput is how many complete per second. They are related through latency, so raising concurrency against a service that has stopped scaling raises latency instead of throughput.
That relationship is the actual finding of most load tests, so push concurrency up in steps and plot throughput against it. The line rises and then flattens, and the point where it flattens while latency climbs is the saturation point. Everything beyond that point is queueing, not work.
Make the test resemble the traffic
A load test that hammers one endpoint with one identical request mostly measures your cache. Three habits keep the traffic shape close enough to reality that the numbers mean something.
Vary the input. Requests that read the same record repeatedly hit warm paths that real traffic does not. Drive the load from a set of identifiers instead of from one.
Mix the operations. Real traffic is mostly reads with some writes, and the writes are usually the expensive part. A read-only load test on a write-heavy API is a comfortable fiction.
Include the think time. Back-to-back requests with zero delay produce a traffic shape no real client generates, and they mostly measure how fast your load generator is.
Where a load test may point
Never at production. A load test deliberately generates traffic beyond normal levels, so pointing it at production degrades the service for real customers to learn something a staging environment could have told you for free.
Two further rules save trouble. Point it at infrastructure you own, because saturating a third-party sandbox is somebody else's incident. And tell whoever is on call before you start, because a load test and an outage look identical on a dashboard.
Where it belongs in the pipeline
Performance runs do not belong in the pull-request gate. They take minutes, they need a quiet environment to produce comparable numbers, and a gate people wait ten minutes for is a gate that eventually gets switched off.
A nightly run against staging with a fixed profile is the version that works. Keep the profile identical between runs, because a performance number is only meaningful next to the previous one. Store the results as well, so a regression shows up as a trend and not as one bad night.
In Routebase
The Test Runner has a mode toggle. In Functional mode a suite makes one assertion-focused pass, and in Performance mode the same suite runs a load profile, so you never maintain a second set of requests for load testing.
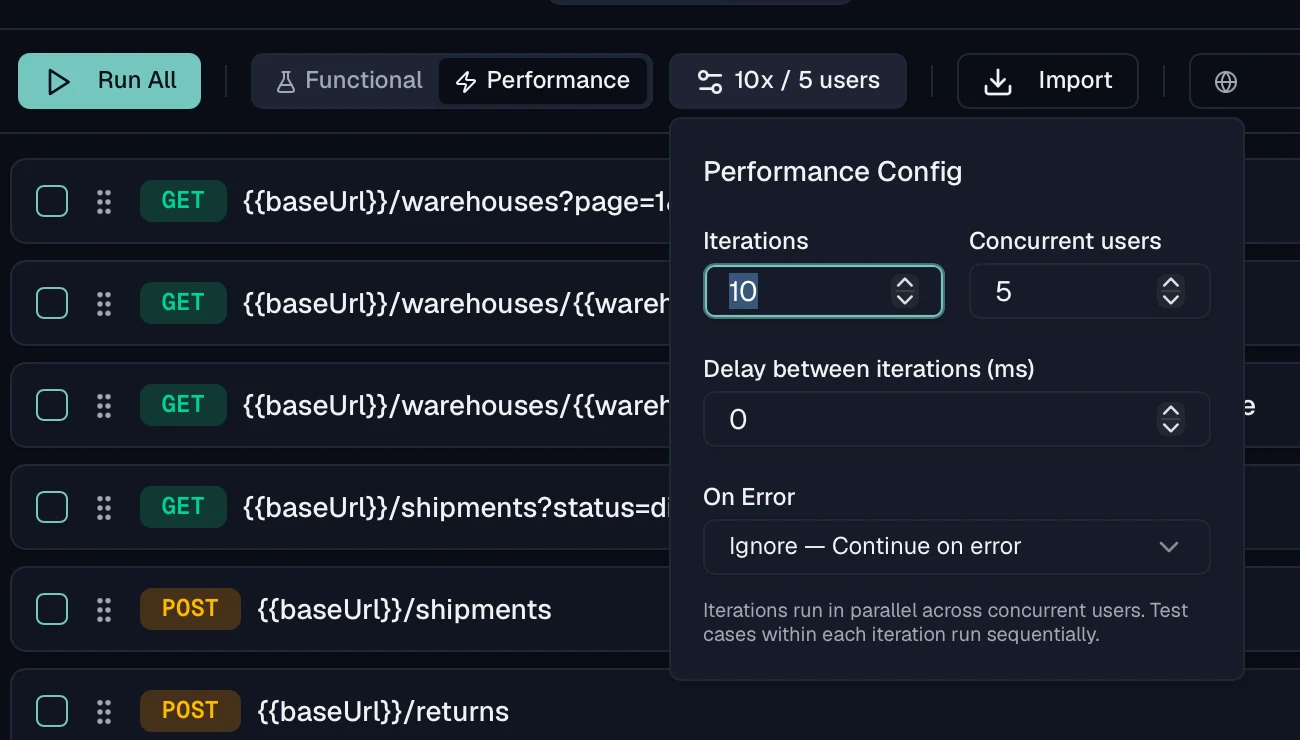
The Performance Config popover sets the profile. Iterations run from 1 to 10,000, threads from 1 to 50, and the delay between iterations from 0 to 60,000 milliseconds, where think time goes. The On Error behaviour decides whether a failure is ignored, skips to the next iteration, or aborts the run. Iterations run in parallel across threads while the cases inside one iteration run in order, so a chained flow keeps its sequence under load.
Results report throughput in requests per second, the P95 response time and the error rate, with a per-case breakdown carrying average, minimum, maximum, P95, error percentage and count for every case in the suite. That breakdown is what turns "the suite got slower" into "the search endpoint got slower and everything else is unchanged".
The mode applies to every run trigger, so a single case, a selection and a full run all follow it. Attach a data set and the load runs across your input rows instead of repeating one request. See the Test Suites guide for the run modes, and Scheduling for putting the nightly profile on a cron expression.
Frequently asked questions
What is API performance testing?
Performance testing measures how an API behaves when many callers arrive at once, rather than whether a single request returns the right answer. It reports latency across a distribution, throughput in requests per second, and the share of requests that failed under load. The output is a set of numbers you compare against a budget, so the useful version of the practice starts by deciding what that budget is.
What is the difference between load testing and stress testing?
A load test applies the traffic you expect on a normal busy day and asks whether the service holds its latency budget. A stress test raises the traffic until something gives, and it asks where the ceiling is and how the service behaves when it is crossed. Load testing verifies a promise, stress testing discovers a limit, and a soak test then checks whether either result still holds after several hours.
Why use the p95 instead of the average response time?
The average hides the tail that users actually experience. A run averaging 120 milliseconds with a p95 of three seconds means one request in twenty took three seconds, and those requests belong to real people who will notice. Percentiles describe the distribution, so a latency budget written as a p95 or p99 target says something an average cannot.
Should load tests run against production?
No. A load test deliberately generates traffic beyond normal levels, so pointing it at production means degrading the service for real customers to learn something a staging environment could have told you. Run load tests against an environment you own and can afford to saturate, and keep production for read-only synthetic checks.
Last reviewed by The Routebase Team.