
Chapter 10 of 12
API Monitoring and Contract Drift in Production
Synthetic checks, contract validation on live responses, field freshness, and alert policies that people do not learn to ignore.
Everything before this chapter runs before the release. API monitoring is what covers the only environment that tells you the truth, meaning the one your customers are using. This chapter is the short version, and the API monitoring guide is the long one.
Two questions, one mechanism
A production check answers two questions with the same request, and most teams only collect the first answer.
Is it up, and how fast is it? This is classic synthetic monitoring, and it produces uptime, latency over time and a history you can point at afterwards.
Does it still return what the contract promises? This is contract validation on live responses, and it is the one that catches drift. Nothing is down, every status code is 200, and the shape of the answer has quietly changed.
The second question costs almost nothing once the first one is set up, because the response is already in hand. Skipping it is how teams end up learning about a renamed field from a consumer.
Synthetic checks and what they are for
A synthetic check is a scripted request on a schedule. Its value over passive telemetry is coverage of paths nobody happens to be calling.
Three design decisions matter.
Pick endpoints that mean something. A health endpoint that returns 200 from a handler with no dependencies tells you the process is running and nothing else. Check the endpoints that touch the database, the queue and the upstream provider, because those are the ones that break.
Keep checks read-only. A monitor that creates data creates data every minute, forever. Where a write path genuinely must be covered, give it a dedicated account and a cleanup path, and accept that it is a different kind of thing from a monitor.
Match the interval to the stakes. One minute for the endpoints that carry the product, five or fifteen for the rest. Every check is real traffic, so a one-minute interval across the whole surface is a load pattern rather than a monitoring strategy.
Validating the contract on live traffic
Contract validation in production is the same idea as a contract test in the pipeline, applied to a response you were fetching anyway.
The design decision that decides whether it works is which version you compare against. There are two sensible answers and one wrong one.
| Baseline | When it is right |
|---|---|
| The version this environment is pinned to serve | Almost always, because it is what the environment promised |
| The latest published version | When nothing is pinned, as a fallback |
| The newest draft | Never, because production is not supposed to serve your work in progress |
The failure mode to watch for is a pin that has fallen behind. The environment now runs 2.1 while the pin still says 2.0, so the monitor keeps checking the old contract and drift against the newer one stays invisible. A monitoring setup that cannot tell you which contract it is checking against is not really checking anything. Keeping those pins honest across several live versions is the subject of running multiple API versions.
Deviations, and which ones deserve to fail a check
Not every mismatch is equal, and treating them alike produces either noise or blindness.
| Deviation | Severity | Why |
|---|---|---|
| A required field is missing | Breaking | Every consumer that reads it fails |
| A field changed type | Breaking | Deserialisation fails, often loudly and far downstream |
| An enum returns a value the contract does not list | Breaking for strict consumers | Anything switching on the value falls through |
| An undocumented field appeared | Informational | Most consumers ignore it, and strict ones do not |
A useful default is to record everything and alert only on the breaking classes. Deviations still accumulate in the record with a first-seen date, so the informational ones are there when somebody asks how long that field has been arriving.
The failure a contract check cannot see
A contract check catches a field that changes shape. It cannot catch a field that keeps its shape and stops changing value.
Consider a lastUpdatedAt frozen since Tuesday, a price feed that went stale after an upstream job died, or a counter that stopped counting. Every one of those passes schema validation perfectly, and every one is a real outage for whoever depends on the number.
Watching specific values for freshness is the answer, and it pays off for the handful of fields where staleness is the actual failure mode. Doing it for everything is wasted effort, since most fields are supposed to sit still.
Alerts people do not learn to ignore
An alerting setup has one failure mode that matters above all others. People stop reading it.
Four rules keep it useful.
Alert on sustained conditions. A rule that fires after three consecutive failures beats one that fires on the first blip, because a single failed check is often a network hiccup.
Give every rule a cooldown. A sustained outage should produce one notification and then be quiet, not one per check for two hours.
Suppress during planned work. A deployment window that pages the person doing the deployment teaches everyone to mute the channel.
Keep the paging set small. Most alerts belong in a channel somebody reads in the morning. The ones that wake a person up should be few enough that each one is worth it.
One consequence deserves stating plainly. An authentication failure on a monitor is not an outage, because the service is fine and the credential expired. Treating those two as the same event is how a rotated token becomes a 3 a.m. incident.
In Routebase
A monitor is a scheduled check against one target, either a URL you type or an endpoint from your specification. Intervals run from 30 seconds to an hour, and each run is recorded as a check with its own timing breakdown. That breakdown covers DNS, connect, TLS, first byte and download, so network latency is separated from server time.
Linking a monitor to an environment applies that environment's variables and authentication to every check. A target URL written against the base URL variable then resolves correctly, and the check carries the configured credentials. Generate from Spec provisions monitors for a whole specification in one wizard, and it is idempotent, so re-running it after adding endpoints fills only the gaps.
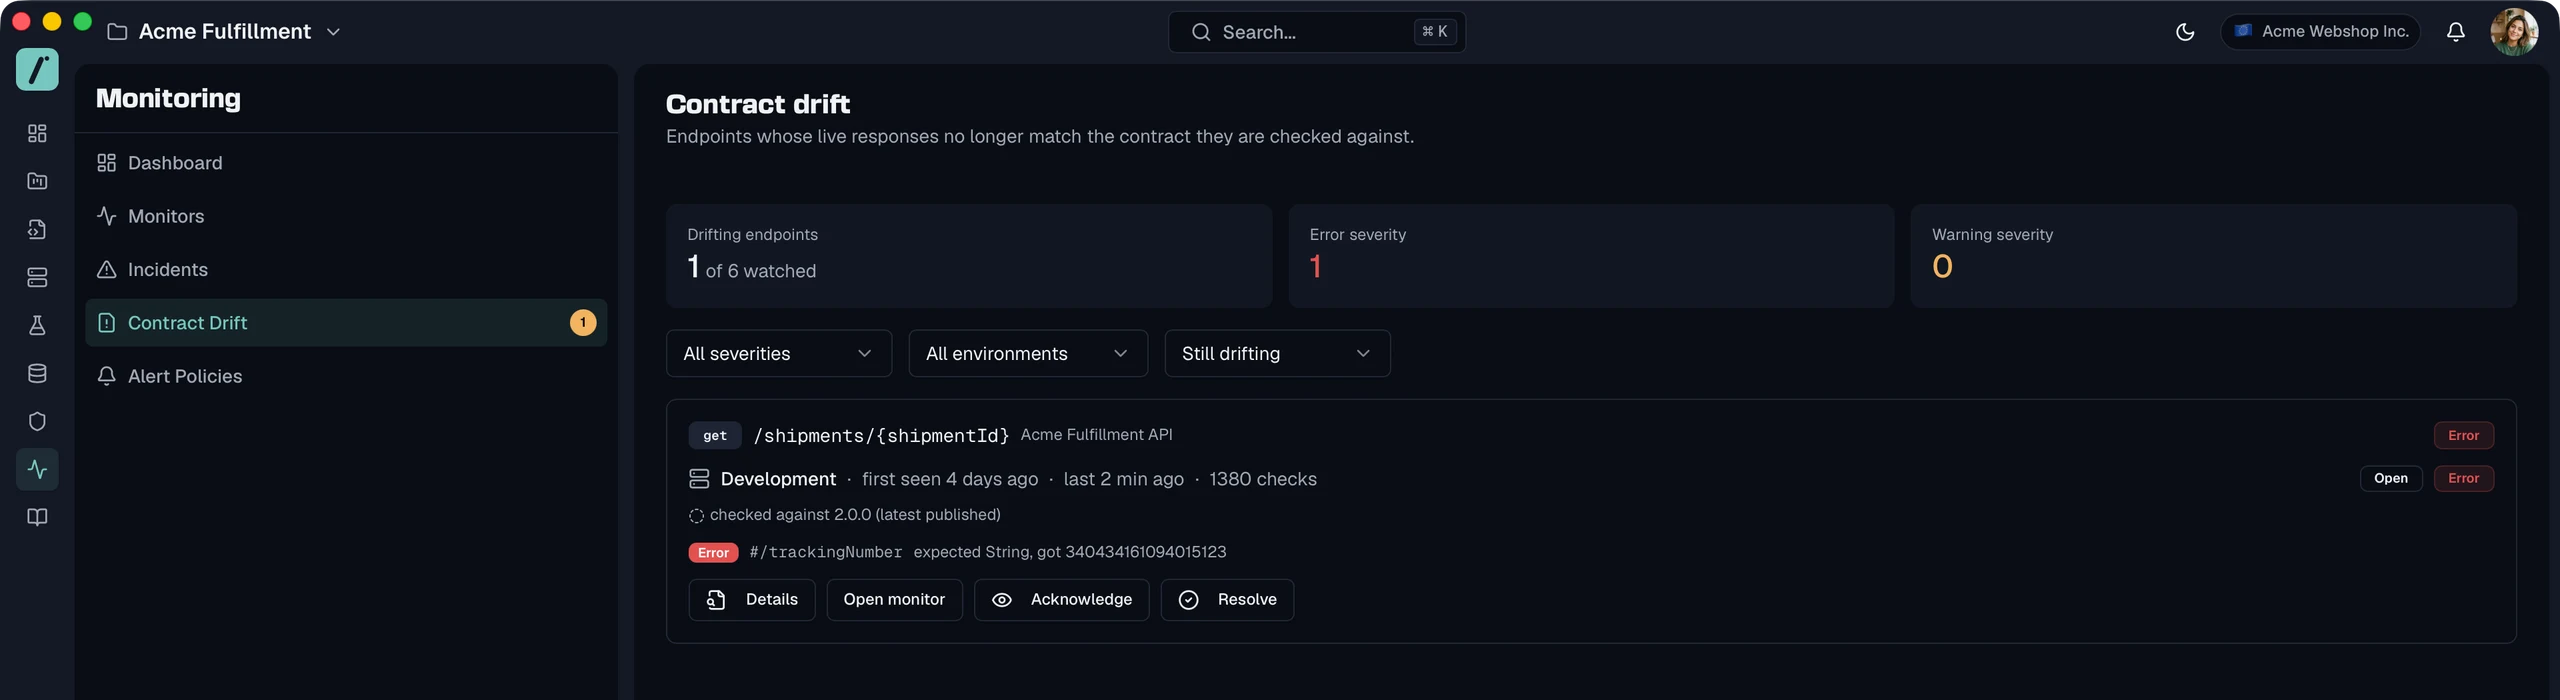
Contract validation runs on the same checks. Each response is validated against the version the environment pins, and where nothing is pinned it falls back to the latest published version. Every drift record names its baseline, so history stays honest after a pin moves, and the monitor detail page turns amber with a Re-pin button when the pin has fallen behind what is published. A deviation that keeps appearing becomes a drift event with a first-seen date, an observation count and a lifecycle you acknowledge and close. The Contract Drift page groups those events per endpoint, across every environment that saw them.
Watch this API for drift does the whole setup from one dialog, provisioning endpoint-linked monitors with validation for a specification in one environment. Disabling it later turns validation off and leaves the monitors running as uptime checks, so no history is lost.
Failed checks carry a structured reason, and an authentication failure gets its own badge instead of looking like an outage. A monitor whose endpoint has never answered reports as waiting for deployment and is excluded from every health figure, so a service that has not shipped yet does not report zero percent uptime. Field freshness watches specific JSONPaths for values that stop changing, and that is the failure a schema check cannot see.
Alert policies carry rules for downtime, latency threshold, error rate and schema drift, each with a cooldown that defaults to 30 minutes. Policies are assigned per environment, per specification or per monitor, with the most specific winning, and maintenance windows suppress alerts during planned work. See Monitors, Contract Drift, Alert Policies and Maintenance Windows.
Frequently asked questions
What is synthetic API monitoring?
Synthetic monitoring sends scripted requests to a live API on a schedule and records what came back. Unlike passive telemetry it does not wait for a customer to hit the broken path, so an endpoint nobody has called since Tuesday still gets checked. The output is uptime, latency over time, and a check history you can point at when somebody asks whether the service was really down.
How do you detect API contract drift in production?
Validate the body of every monitoring check against the contract the environment is supposed to be serving, rather than only checking the status code. A deviation that keeps appearing becomes a drift record with a first-seen date and an observation count, which turns a silent mismatch into something with an owner. The important design decision is which version you validate against, because comparing against the wrong one produces either noise or false confidence.
How often should an API monitor run?
Match the interval to how quickly you need to know and how expensive the check is. A one-minute interval on the handful of endpoints that carry your product is reasonable, while five or fifteen minutes is plenty for the long tail. Remember that every check is real traffic against real infrastructure, so a one-minute interval across two hundred endpoints is a load pattern rather than a monitoring strategy.
How do you avoid alert fatigue from API monitoring?
Alert on sustained conditions rather than on single events, so a rule that fires after several consecutive failures beats one that fires on the first blip. Give every rule a cooldown so a long outage produces one notification rather than a hundred, and suppress alerts during planned maintenance. Keep the set of things that page a human small enough that each one is worth waking up for.
Last reviewed by The Routebase Team.