
API Monitoring: A Complete Guide
What API monitoring covers, how uptime, latency and correctness differ as questions, where monitoring stops and testing or observability begins, and how to run all of it against your contract.
An API that answers is not the same as an API that is right. Most monitoring setups only measure the first of those, which is why the outage everyone remembers is the one where every dashboard stayed green.
This guide covers what to watch on a live API, which kind of check answers which question, and how to alert on the results without training your team to ignore the channel. It then covers the part that status codes cannot reach, which is whether the response still matches the contract you published.
Three questions, one request
Every scheduled call to your API can answer three different questions, and each one needs something different to be judged against.
Is it up? The status code answers this one on its own, which is why uptime is the cheapest thing to monitor and the first thing every tool offers.
How fast is it? A clock answers this one, and the answer is only useful as a distribution over time rather than as a single number.
Is it right? Nothing in the response answers this by itself, because a wrong body and a correct body are both served with a 200. Judging it needs a description of what the response was supposed to look like, which is what an OpenAPI contract is.
The third question is the expensive one to skip. Downtime is loud and somebody notices within minutes, while a renamed field is silent and gets noticed by a consumer's parser three weeks later.
Where monitoring stops
Monitoring is one of four things that get called monitoring, and the differences decide what you should expect each one to catch.
| It is not | Because |
|---|---|
| Testing | Tests run before a release against a build you control, so they can write data and block a merge. Monitors run after it, read-only, against the environment customers use. |
| Observability | Traces, logs and metrics describe the service from the inside. A monitor has no privileged access and sees exactly what a consumer sees. |
| A status page | A status page is a statement you publish. Monitoring is the measurement you make, and the second one should drive the first rather than the reverse. |
| Incident management | An incident is what you open once monitoring has decided something is wrong. The rules that make that decision are the interesting part. |
Contract testing is the closest neighbour of all, because it asks the same question as contract monitoring. The difference is the side of the release it stands on, which contract testing versus integration testing works through in full.
The loop that closes
Monitoring gets much better when the thing being monitored and the thing describing it are the same document.
Your contract lists the endpoints, so the monitors can be generated from it rather than typed in. Each endpoint carries its response schema, so every check can validate the body it already fetched. The environment records which version it is meant to be serving, so the check knows which promise to hold the response against. When you publish a new version, the baseline moves with it.
That loop is what turns monitoring from an uptime dashboard into a continuous check that production still does what you documented. It also means the monitoring setup is only as good as the contract behind it, so a specification full of untyped objects validates almost nothing.
The short answer
If you take one rule from this guide, take this one. Alert on sustained conditions rather than single events, and validate the body rather than the status code.
The rest of the guide is that rule taken apart.
| Chapter | Answers |
|---|---|
| Types of checks | Health, synthetic, contract and SLA checks, and what each one misses |
| Uptime, latency and SLAs | p95 against the average, error budgets, and the arithmetic behind 99.9 |
| Alerting without the noise | Thresholds, windows, cooldowns, and which alerts earn a phone call |
| Incidents and maintenance | When a failure becomes an incident, and how planned work stays quiet |
| Contract drift | Monitoring correctness, and why a 200 proves nothing about it |
| Design-first monitoring | Monitors that exist before the service and wait instead of paging |
| Authentication for monitors | Real credentials on a schedule, and why an expired token is not an outage |
| Data freshness | The field that keeps its shape and stops changing its value |
| What to look for in a tool | Nine criteria, written as questions rather than as a vendor list |
In Routebase
Monitoring in Routebase is a project-level area with a health dashboard, the monitors themselves, incidents, contract drift and the alert policies that connect them.
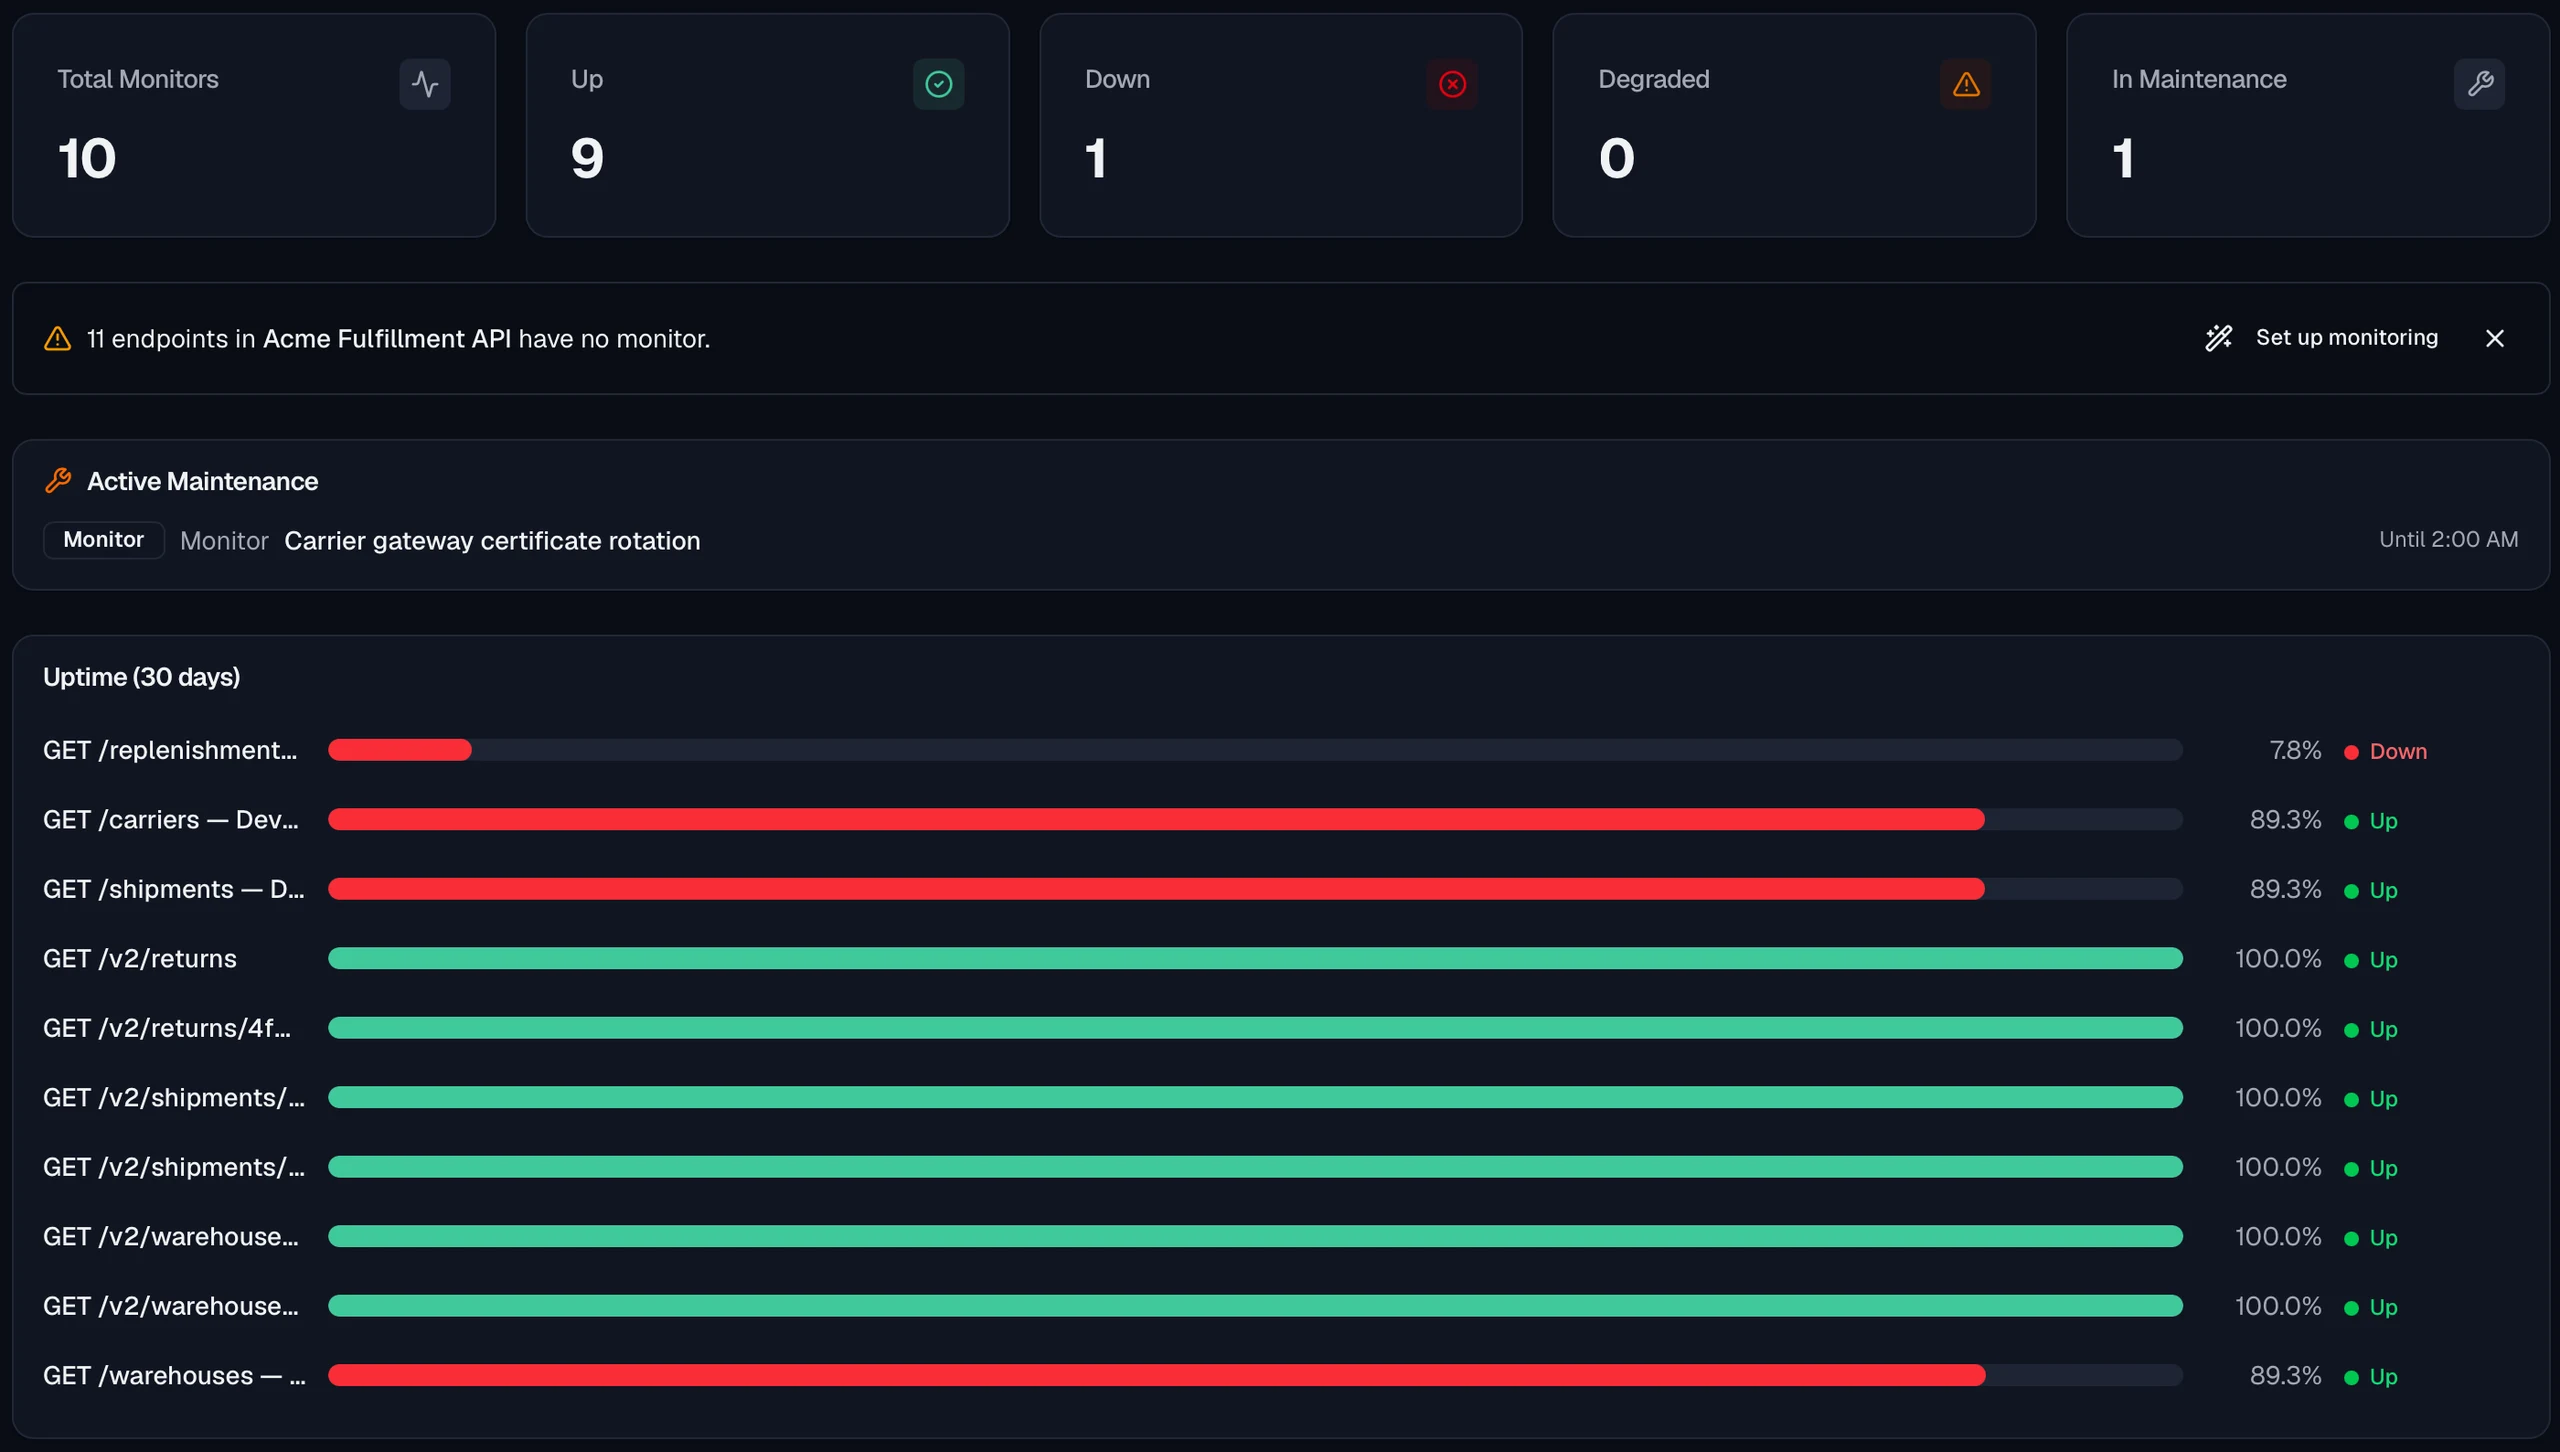
A monitor is a scheduled HTTP check against a URL you type or an endpoint from your specification, and every run is recorded as a check with its own timing breakdown. Checks feed uptime and latency figures, alert rules evaluate them, and incidents open when failures persist. Because a monitor can be linked to a documented endpoint, the same check also validates the response body against the version the environment is pinned to.
The product page for API monitoring walks the whole surface from the generated monitor to the alert. Start with the Monitoring overview in the product documentation, or read on. The testing guide covers the half of this that runs before the release.
Frequently asked questions
What is API monitoring?
API monitoring is the practice of calling a live API on a schedule and recording what came back, so problems are found by you rather than reported by a customer. Each run produces a status code, a response time and a body, and from a history of those you get uptime, latency trends and a record you can point at afterwards. The important part is that monitoring runs against the environment your consumers actually use, which is the only one that can tell you the truth.
What is the difference between API monitoring and API testing?
They ask the same question at different moments. Tests run before a release against a build you control, so they can create data, run destructive cases and block a merge. Monitors run after the release against production, so they are read-only, scheduled and judged on how quickly they notice. A team that has one and not the other is either shipping blind or running blind.
Is API monitoring the same as observability?
No, because they look from opposite sides. Observability tools such as Datadog, Dynatrace or Splunk instrument the service from the inside and report traces, logs and metrics about its own behaviour. A monitor stands outside with no privileged access and asks what a consumer would ask, which is why it catches a broken gateway, an expired certificate or a response that no longer matches the contract.
What should you monitor on an API?
Three things, in this order. Whether it answers at all, how long it takes to answer, and whether the answer still matches what the contract promises. The third one is the one most setups skip, and it is also the one that fails silently. A drifting endpoint returns a perfectly healthy 200 while a consumer downstream breaks on a field that changed shape.
Last reviewed by The Routebase Team.