
Chapter 02 of 09
API Uptime, Latency and SLAs: What to Measure and How to Read It
Why the average response time hides the problem, what each additional nine actually costs in minutes, and how to keep an uptime figure honest enough to publish.
Two numbers get published about every API, and both are routinely reported in a way that hides the problem they exist to expose. This chapter covers how to read them and what the targets actually cost.
The average is the wrong number
An average response time answers a question nobody asked, which is how long a typical request took when nothing was wrong.
Consider an endpoint where 95 out of 100 calls return in 80 milliseconds and the remaining five take six seconds. The average lands around 375 milliseconds, which looks acceptable and describes not a single real request. One user in twenty is waiting six seconds, and the number you are reporting says nothing about them.
Percentiles fix that by describing the tail instead of the middle.
| Statistic | What it tells you | When to use it |
|---|---|---|
| Average | The bulk, pulled around by outliers | Comparing two periods of the same endpoint |
| p50, the median | The typical request, ignoring the tail | A sanity check next to the p95 |
| p95 | The experience of the unluckiest one in twenty | The default target for a public API |
| p99 | Where the systemic problems hide | High-traffic endpoints, where one in a hundred is a lot of people |
| Max | One request, possibly a network blip | Debugging, never reporting |
A useful habit is to publish a p95 target and to watch the p50 next to it. When the two drift apart, the slow path is a subset of requests rather than a general slowdown, and that subset is usually something you can name.
Where you measure changes the number
A response time measured inside your own process excludes DNS, the TLS handshake, the connection and every hop between you and the caller. A monitor standing outside includes all of it, which is why its number is larger and more honest.
The useful version separates those phases rather than reporting one figure. Say a check slows from 90 to 400 milliseconds. Knowing whether the extra 310 went into the handshake or into the time to first byte is the difference between calling the network team and reading your own query log.
Uptime, and what counts as down
Uptime is the share of checks that succeeded over a window, and every part of that sentence is a decision.
What counts as a failure. A timeout and a 503 clearly do. A 429 from your own rate limiter probably does not, because the service is behaving as designed. A 401 caused by an expired monitoring credential definitely does not, because the service is fine and your check is broken.
Which window. A 24-hour window reacts fast and forgets fast, while a 30-day window is what a customer will quote at you. Report both, because the first one is for you and the second one is for them.
What gets excluded. Checks that could not run at all must not count as failures. A monitor whose endpoint has never been deployed, or whose target URL still contains an unresolved path parameter, has measured nothing. Recording those as downtime produces a figure that is wrong in the direction that makes you look worse than you are.
What a nine actually costs
The gap between two uptime targets is easier to argue about than to picture, so here it is in minutes. A month is taken as 30 days, which is 43,200 minutes.
| Target | Per 30-day month | Per year |
|---|---|---|
| 99% | 7 hours 12 minutes | 3 days 15 hours |
| 99.5% | 3 hours 36 minutes | 1 day 20 hours |
| 99.9% | 43 minutes 12 seconds | 8 hours 46 minutes |
| 99.95% | 21 minutes 36 seconds | 4 hours 23 minutes |
| 99.99% | 4 minutes 19 seconds | 52 minutes 34 seconds |
Two things follow from the table. Above 99.9 percent, planned maintenance has to stop being downtime, which means rolling deployments rather than windows. And at 99.99 percent the detection time itself becomes the budget, because a five-minute check interval already exceeds the monthly allowance.
Error budgets, and why they are useful
The inverse of an uptime target is a budget you are allowed to spend. At 99.9 percent you have 43 minutes a month, and the question stops being whether you had an outage and becomes how much of the month you have left.
The budget is useful mostly as a decision rule. A team that has spent 5 percent of it by the tenth can ship the risky change, while a team that has spent 90 percent should be stabilising instead. It turns reliability from an argument about blame into arithmetic anyone can check.
SLI, SLO and SLA
Three terms that get used interchangeably, and keeping them apart is what stops you promising something you cannot measure.
The indicator is what you measure, such as the share of successful checks over 30 days. The objective is your internal target for that indicator. The agreement is the promise made to a customer, usually with a remedy attached.
The order matters, because the agreement should be the loosest of the three. If you promise 99.9 percent and hold yourself to 99.9 percent, the first bad month is a contractual event. If you promise 99.5 and target 99.9, you have margin, and the margin is the point.
In Routebase
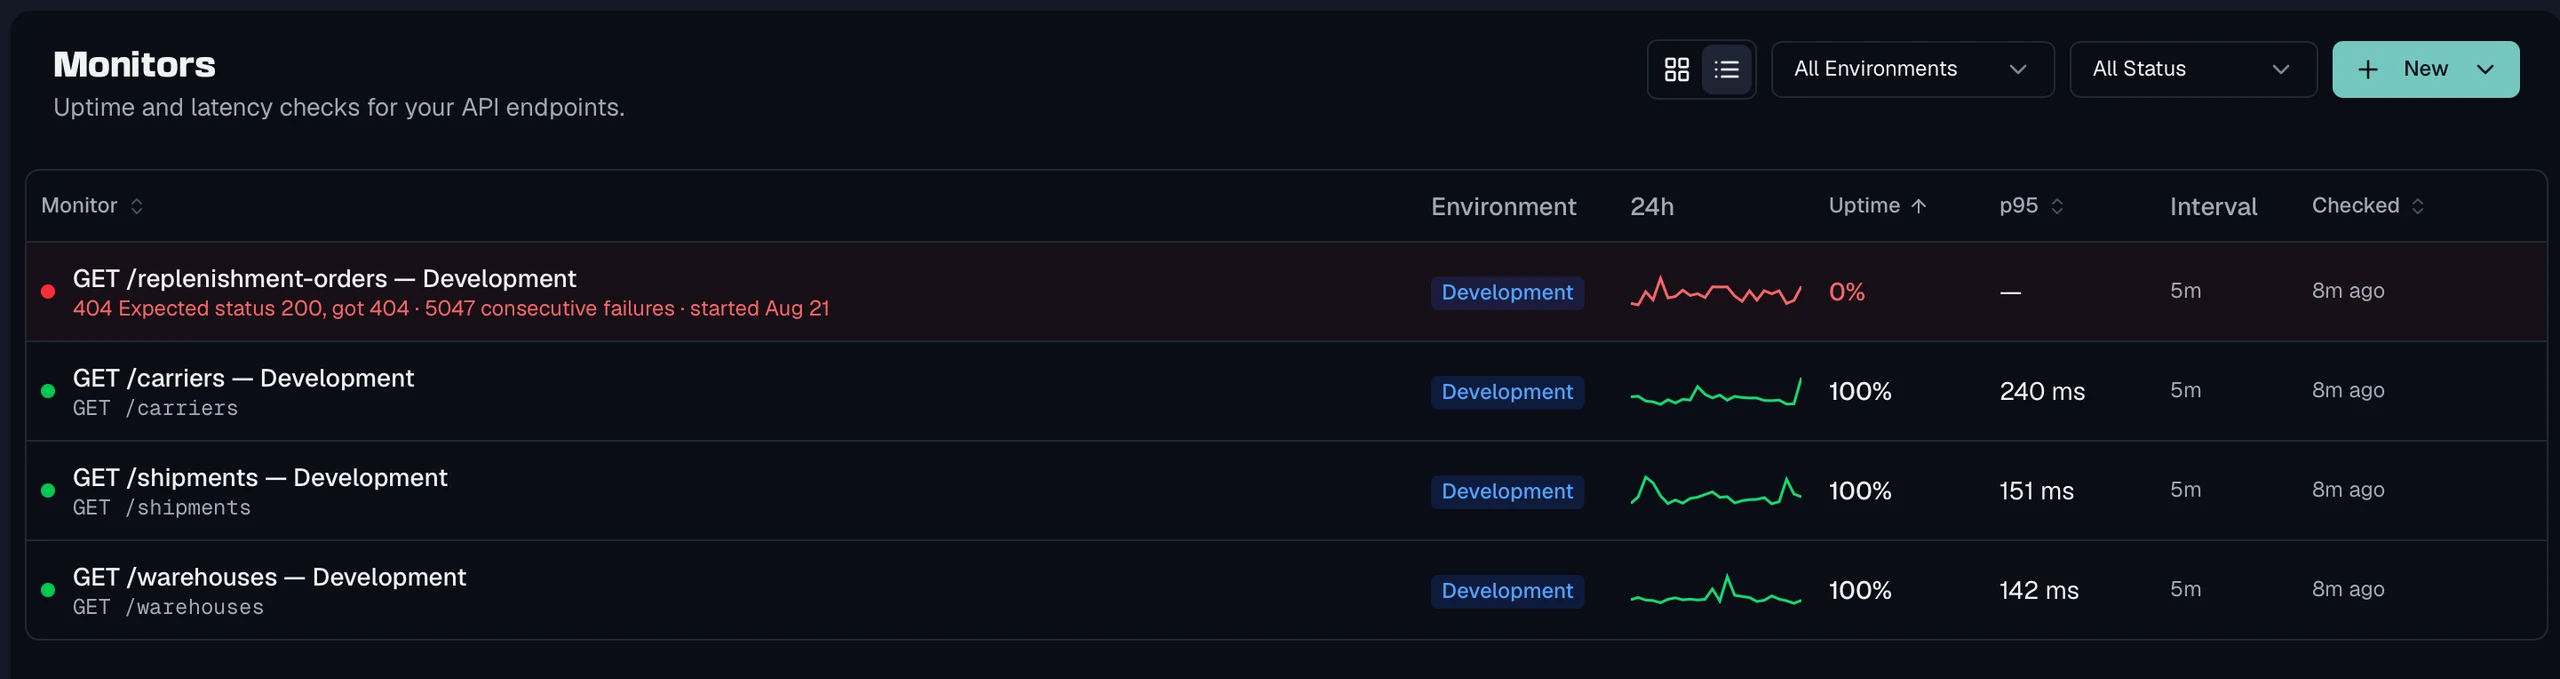
Every monitor keeps uptime over 24 hours, 7 days and 30 days, plus its average response time and its p95. The monitors list gives you those figures in a grid or in a sortable table, next to a 24-hour sparkline. That sparkline leaves a gap for hours where no check ran rather than drawing a straight line through them.
Each check records its own timing breakdown across DNS, connect, TLS, first byte and download, so a slowdown can be placed in the network or in the service. The health dashboard shows 30-day uptime as one bar per monitor, coloured green from 99.5 percent and yellow from 95 percent, sorted so the failing ones come first.
Two states are excluded from every health figure on purpose, which are a monitor waiting for its endpoint to be deployed and one waiting for a path parameter value. Neither has measured anything, so neither is allowed to move the number. See Monitors and the Monitoring overview.
Frequently asked questions
What is a good API response time?
There is no universal number, because a search endpoint and a payment confirmation are judged by different people against different expectations. What matters is that you state the target as a percentile rather than as an average, and that you measure it where your consumers stand rather than inside your own process. A p95 of 300 milliseconds is a claim somebody can check, while an average of 300 milliseconds is a number that survives one request in twenty taking four seconds.
Why use p95 instead of the average response time?
The average is pulled towards the bulk of fast requests and hides the tail where the pain is. If 95 percent of calls take 80 milliseconds and 5 percent take six seconds, the average stays comfortable while one user in twenty is having a bad time. The p95 is the value that 95 percent of requests came in under, so it describes the experience at the edge rather than in the middle.
How much downtime does 99.9 percent uptime allow?
Over a 30-day month, 99.9 percent allows 43 minutes and 12 seconds of downtime, and over a year it allows 8 hours and 46 minutes. The step to 99.99 percent cuts the monthly allowance to 4 minutes and 19 seconds, which is less than most deployments take. That is why each additional nine is an architecture decision rather than a target you can simply adopt.
What is the difference between an SLA, an SLO and an SLI?
An SLI is the indicator you measure, such as the share of successful checks over 30 days. An SLO is the target you hold yourself to for that indicator, and it should be stricter than what you promise. An SLA is the contractual promise to a customer, usually with a remedy such as a service credit attached, which is why the number in it should have margin over the SLO.
Last reviewed by The Routebase Team.